Security Onion SOC Home Lab Project
Building, troubleshooting, and validating a VirtualBox blue team lab using Security Onion, Kali Linux, and Ubuntu.

In this report, I walk through my Security Onion SOC home lab project, where I built a small but realistic blue team environment in Oracle VirtualBox using Security Onion, Kali Linux, and Ubuntu.
The goal of this project was to create a controlled lab where I could generate attacker traffic from Kali Linux, send it toward a victim machine, and then use Security Onion to detect, analyse, and review that activity through alerts, dashboards, and packet evidence.
What made this project especially valuable was not just the final working setup, but the full process of getting there. I had to troubleshoot interface assignments, VirtualBox networking, Security Onion deployment issues, and connectivity problems before the environment finally worked end to end. That process taught me that effective monitoring depends just as much on network design and visibility as it does on the tools themselves.
By the end of the project, I had a working Security Onion lab that successfully detected:
- ICMP ping traffic
curlHTTP requests- Python HTTP server traffic
- Nmap service and version detection
- Nmap scripting engine activity
- OS detection style reconnaissance
Project Scope
This lab was built as a practical blue team project to strengthen my skills in:
- SOC monitoring
- network visibility
- troubleshooting
- attack simulation
- alert validation
- investigation workflow
The project focused on getting the lab working properly, generating realistic traffic, and confirming that Security Onion could reliably capture and classify that activity.
Lab Environment
Host System
Windows host machine
Virtualization Platform
Oracle VirtualBox
Virtual Machines
- Security Onion 2.4.201
- Kali Linux
- Ubuntu Desktop
Final IP Addressing
- Security Onion management:
192.168.56.10/24 - Kali attacker:
10.10.10.20/24 - Ubuntu victim:
10.10.10.30/24
Phase 1: Planning the Lab Architecture
Before generating any alerts, I needed to design the lab so traffic would actually pass through a segment Security Onion could monitor.
The final working design was:
Security Onion
- Management NIC:
enp0s3 - Monitoring NIC:
enp0s8 - Monitoring interface attached to
bond0 - Web interface reachable at
https://192.168.56.10
Kali
- Used as the attacker machine
- Connected to the monitored segment
- Static IP on the monitored network
Ubuntu
- Used as the victim machine
- Exposed a simple HTTP service for testing
- Static IP on the monitored network
Traffic Flow
Kali → Ubuntu → monitored by Security Onion
This ended up being a much better design than my original attempt, where I tried scanning Security Onion’s management interface directly. That early approach helped me realise that a healthy deployment does not automatically mean the right traffic is being seen.
Phase 2: Initial Security Onion Deployment
I started by creating a Security Onion virtual machine in VirtualBox and assigning it two network adapters.
Initial Adapter Design
- Adapter 1: management
- Adapter 2: monitoring / sniffing
Later, in the final working deployment, those mapped to:
enp0s3for managementenp0s8for monitoring
At the beginning, my focus was simply to get Security Onion installed and functioning correctly.
What I Confirmed
- the VM booted correctly
- the installation completed
- the web interface was reachable
so-statuseventually showed the system was healthy
This was important because it confirmed the platform itself could run properly before I started testing detection.
Phase 3: First Traffic Testing Attempt
My first attempt at traffic generation was too simplistic. I tried scanning the Security Onion management IP directly from my Windows host.
Test Performed
1
nmap -A 192.168.56.10
Result
This did not generate the results I expected.
What I Learned
This was my first major lesson in the project. I realised that the management interface was not the same thing as the monitored traffic path. Even though Security Onion was installed and healthy, it was not guaranteed that traffic aimed at the management interface would be seen in the way I expected by the monitoring side of the deployment.
In other words, the platform was working, but the lab design was wrong.
That was the point where I understood I needed a dedicated attacker VM and a dedicated victim VM so Security Onion could monitor the traffic flowing between them properly.
Phase 4: Adding Kali Linux as the Attacker
Once I moved away from testing from my Windows host, I imported Kali Linux into VirtualBox and configured it as the attacker system.
Kali Login
- Username:
kali - Password:
kali
Initial Verification
After logging in, I checked the network interface with:
1
ip -br a
I then used commands such as:
1
2
3
4
sudo ip addr add 10.10.10.20/24 dev eth0
sudo ip link set eth0 up
ip -br a
ip route
What I Was Trying to Achieve
I wanted Kali to sit cleanly on the monitored segment so I could:
- ping the victim
- send HTTP requests
- run Nmap scans
- generate traffic that Security Onion would detect
At this stage, Kali itself was not the hardest part. The real challenge was making sure the attacker, victim, and monitoring platform were all aligned on the same network design.
Phase 5: Troubleshooting Security Onion
This was the longest and most frustrating part of the project, but also the part that taught me the most.
Problems I Encountered
- the Alerts page returned errors early on
so-testcould not complete because the VM lacked internet accessso-monitor-addfailed in the earlier broken deployment- monitor interface selection was inconsistent
- traffic was not being seen where I expected it to be
- some VirtualBox networking paths did not behave the way I initially assumed
To work through this, I spent time checking:
so-status- interface assignments
ip -br a- whether
bond0existed - whether the monitor interface had actually been selected properly
At one point, I realised that continuing to patch a messy deployment was wasting time. Instead of forcing a half-broken setup to work, I decided to rebuild Security Onion from scratch with a cleaner design.
That ended up being the right decision.
Phase 6: Reinstalling Security Onion Correctly
I reinstalled Security Onion and used a cleaner, more deliberate setup process.
Setup Choices
- changed the hostname from the default to
sohome - selected
enp0s3as management - selected static IP mode
- assigned management IP
192.168.56.10/24 - used gateway
192.168.56.1 - set DNS as
8.8.8.8,8.8.4.4 - used
searchdomain.localas a simple lab search domain - selected
enp0s8as the monitor NIC - selected IP-based web access
- allowed subnet
192.168.56.0/24 - created SOC admin user
admin@sohome.local - chose EVAL node type
Important Deployment Issue
The first time I ran setup in Standard mode, it attempted to reach external Security Onion resources and failed because the VM did not have internet access.
I saw errors related to resolving and contacting external hosts, so I stopped that setup and reran it in Airgap mode. That turned out to be the correct choice for an isolated lab.
Command Used to Relaunch Setup
1
sudo SecurityOnion/setup/so-setup iso
Final Result
Security Onion completed setup successfully and displayed the EVAL completion message.
That was the point where I knew the rebuild had fixed the earlier design problems.
Phase 7: Verifying the Security Onion Deployment
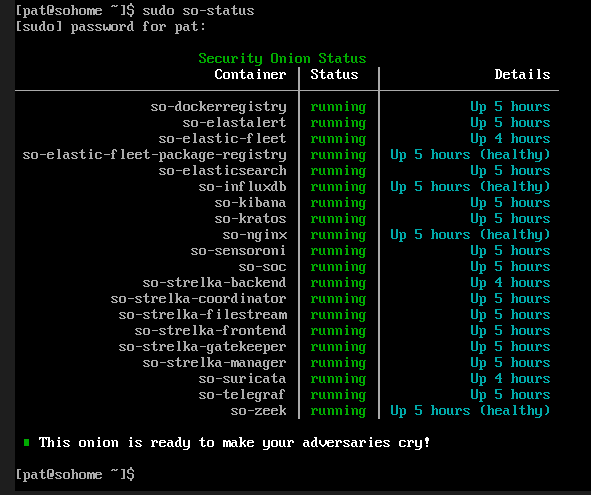
After setup completed, I logged back in and checked the health of the platform.
Commands Used
1
2
sudo so-status
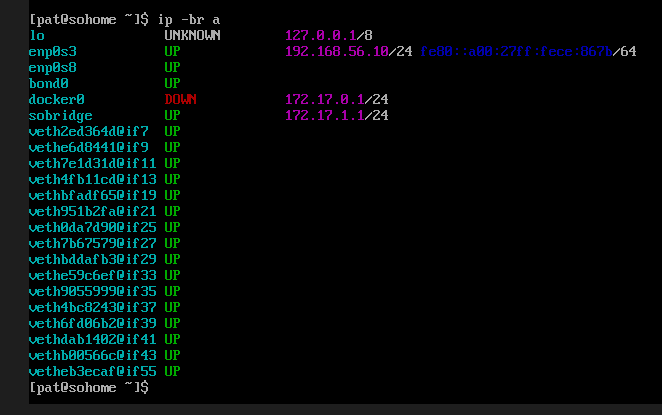
ip -br a
What I Confirmed
- the core containers were running
enp0s3had192.168.56.10/24bond0existed and was up- the system was ready for monitoring
Why This Mattered
This was the first point where I was confident the SOC platform itself was properly built. From there, I could move on to the attacker and victim systems without second-guessing the foundation.
Phase 8: Building the Ubuntu Victim Machine
Once Security Onion was stable, I created and configured the Ubuntu victim VM.
Ubuntu Installation
I installed Ubuntu in VirtualBox and created a local user:
- Username:
victim
I had some issues with the graphical login, so I also used the terminal to continue setup. That was completely fine for this type of lab.
Ubuntu Network Configuration
At first, I tried temporary addressing using ip addr add, but I noticed the address was not being retained cleanly. To make the configuration more reliable, I switched to NetworkManager.
Commands Used to Inspect the Interface
1
2
3
4
ip -br a
ip route
nmcli device status
nmcli connection show
Commands Used to Assign the Static IP
1
2
3
sudo nmcli connection mod "Wired connection 1" ipv4.method manual ipv4.addresses 10.10.10.30/24 ipv6.method ignore
sudo nmcli connection down "Wired connection 1"
sudo nmcli connection up "Wired connection 1"
Commands Used to Verify the Result
1
2
3
ip -br a
ip addr show dev enp0s3
ip route
Result
Ubuntu ended up with:
- interface:
enp0s3 - IP address:
10.10.10.30/24
This gave me a stable victim machine on the monitored segment.
Phase 9: Starting a Target Service on Ubuntu
To give Kali something real to interact with, I launched a simple Python web server on Ubuntu.
Command Used
1
python3 -m http.server 8000
This exposed an HTTP service on port 8000.
Why I Did This
I wanted a live service that would:
- respond to
curl - show up in Nmap
- generate application-layer traffic that Suricata could inspect
This turned out to be a very effective test service because it was simple, reliable, and easy to validate from the attacker side.
Phase 10: Finishing Kali Configuration
I then returned to Kali and finished configuring it on the monitored segment.
Commands Used
1
2
3
4
ip -br a
sudo ip addr add 10.10.10.20/24 dev eth0
sudo ip link set eth0 up
ip route
At one stage, Kali still reported:
1
Network is unreachable
That told me Kali’s network profile still was not fully aligned with the victim.
I rechecked the addressing and routing until I confirmed:
- interface:
eth0 - IP address:
10.10.10.20/24 - route:
10.10.10.0/24 dev eth0
Once that was fixed, Kali was properly positioned on the monitored network.
Phase 11: Connectivity Testing Between Kali and Ubuntu
Before focusing on alerts, I first needed to confirm that Kali and Ubuntu could actually communicate.
Ping Test
1
ping -c 4 10.10.10.30
HTTP Test
1
curl http://10.10.10.30:8000/
Why This Step Was Important
This was a critical validation step. I learned that there is no point investigating IDS alerts if the underlying traffic flow does not exist.
Connectivity testing helped me confirm:
- the attacker and victim were on the same segment
- traffic could reach the service
- the lab was finally ready for detection testing
Phase 12: Generating Detection Traffic
Once Kali and Ubuntu were communicating properly, I started generating the kinds of traffic I wanted Security Onion to detect.
ICMP Test
1
ping -c 4 10.10.10.30
HTTP Request with curl
1
curl http://10.10.10.30:8000/
Nmap Service and Version Detection
1
nmap -sV -p 8000 10.10.10.30
More Aggressive Scan
1
nmap -A 10.10.10.30
What This Produced
These commands generated exactly the kind of traffic I wanted for a beginner SOC home lab:
- pings
- HTTP traffic
- Nmap version detection
- Nmap scripting engine traffic
- OS detection style probing
This was realistic enough to test alert visibility without making the lab unnecessarily complex.
Phase 13: Validating Detection in Security Onion
After generating the traffic, I opened the Security Onion web interface and checked the detections.
Web Interface
https://192.168.56.10
Username
admin@sohome.local
Where I Checked
I reviewed the results in this order:
- Dashboards
- Alerts
- Hunt
This time, the detections appeared as expected.
Major Alerts Observed
ET INFO Python SimpleHTTP ServerBannerET SCAN Nmap Scripting Engine User-Agent Detected (Nmap Scripting Engine)ET SCAN Possible Nmap User-Agent ObservedGPL ICMP PING *NIXET HUNTING curl User-Agent to Dotted QuadET SCAN NMAP OS Detection Probe- multiple suspicious inbound scan alerts tied to Nmap behaviour
This was the point where I knew the lab was finally working end to end.
Phase 14: Example Alert Analysis
One of the clearest alerts I investigated was:
ET SCAN Nmap Scripting Engine User-Agent Detected (Nmap Scripting Engine)
Important Fields from the Alert
- Source IP:
10.10.10.20 - Destination IP:
10.10.10.30 - Destination Port:
8000 - Interface:
bond0 - Application protocol:
HTTP - Payload showed an
OPTIONS / HTTP/1.1request - User-Agent identified itself as
Nmap Scripting Engine
Analyst Interpretation
This alert showed that Security Onion successfully captured and decoded HTTP reconnaissance traffic from Kali to the Ubuntu target. By itself, it was not evidence of compromise, but it was strong evidence of active service enumeration.
Professional Conclusion
I would classify this as suspicious reconnaissance or scanning activity. In a real SOC workflow, I would pivot on:
- source IP
- destination IP
- community ID
- associated alerts
- related packet capture
This project helped me practise that thought process in a controlled environment.
What This Project Demonstrated
This project showed that I can:
- deploy and configure Security Onion in a virtual lab
- distinguish between management traffic and monitored traffic
- troubleshoot interface mapping and network design issues
- configure attacker and victim machines for realistic testing
- use Linux networking tools to verify addressing and routing
- generate test traffic using common attacker tools
- validate detections in Security Onion
- interpret Suricata alerts in context
- document the full build and troubleshooting process
Lessons I Learned
This project reinforced several important lessons for me.
1. Monitoring depends on architecture
A tool can be installed perfectly and still detect nothing if the traffic path is wrong.
2. Rebuilding cleanly can be smarter than patching forever
Once I realised my first deployment path was messy, rebuilding Security Onion cleanly in EVAL mode saved time and gave me a better final result.
3. Connectivity testing comes before alert hunting
I learned to verify:
- IP address
- route
- link state
- service availability
before assuming the IDS was broken.
4. A realistic lab needs separate roles
Using separate attacker, victim, and monitoring systems made the environment more realistic and much more useful for blue team practice.
Final Outcome
By the end of this project, I had built a working SOC home lab in VirtualBox with:
- Security Onion as the monitoring platform
- Kali Linux as the attacker
- Ubuntu as the victim
- live detection of ping,
curl, HTTP, and Nmap traffic - successful alert review through Security Onion’s interface
This gave me a practical environment to continue building SOC analyst and blue team skills.
Summary
Overall, this project was a really good example of how much practical security monitoring depends on getting the environment design right. What started as a simple goal of building a home lab turned into a full troubleshooting exercise involving interface mapping, deployment decisions, routing, connectivity validation, and alert verification.
Working through the setup step by step helped me understand that Security Onion is only as effective as the visibility you give it. Once I corrected the network design and rebuilt the deployment cleanly, the whole lab started to make sense. From there, I could generate realistic traffic from Kali, observe it hitting the Ubuntu victim, and then confirm that Security Onion was detecting it through Suricata alerts, dashboards, and hunt data.
What stood out most to me was how important it is to stay methodical when building and troubleshooting a monitoring environment. A broken alert pipeline does not always mean the tool itself is failing. Sometimes the issue is simply that the traffic is not going where you think it is, or the interfaces are not being used the way you assumed.
For me, this project reinforced the value of validating each layer properly. I had to confirm the platform health, then the interface setup, then the attacker and victim addressing, then service reachability, and only after that did the alert analysis really become meaningful. That process made the lab much more useful than if everything had worked on the first attempt, because I came away with a better understanding of both the tooling and the network behaviour behind it.