ICS FuelStation Challenge – LetsDefend
Incident investigation and response of an ICS FuelStation alert using LetsDefend.

In this report, I walk through my investigation of the ICS FuelStation challenge on LetsDefend. The scenario takes place in an industrial environment where a critical operational endpoint was flagged by security tooling after a suspicious file with an unusual extension was identified.
The goal of this investigation is to show practical threat hunting and network traffic analysis skills by using the provided evidence to trace the attacker’s behaviour from start to finish, beginning with the first signs of network activity and moving through discovery, access, and the follow-on actions linked to command-and-control (C2) style communication.
Evidence Provided
The primary artifact supplied for analysis is a compressed bundle located at:
1
/root/Desktop/LD-ICS-FUELSTATION-COMPROMISE.zip
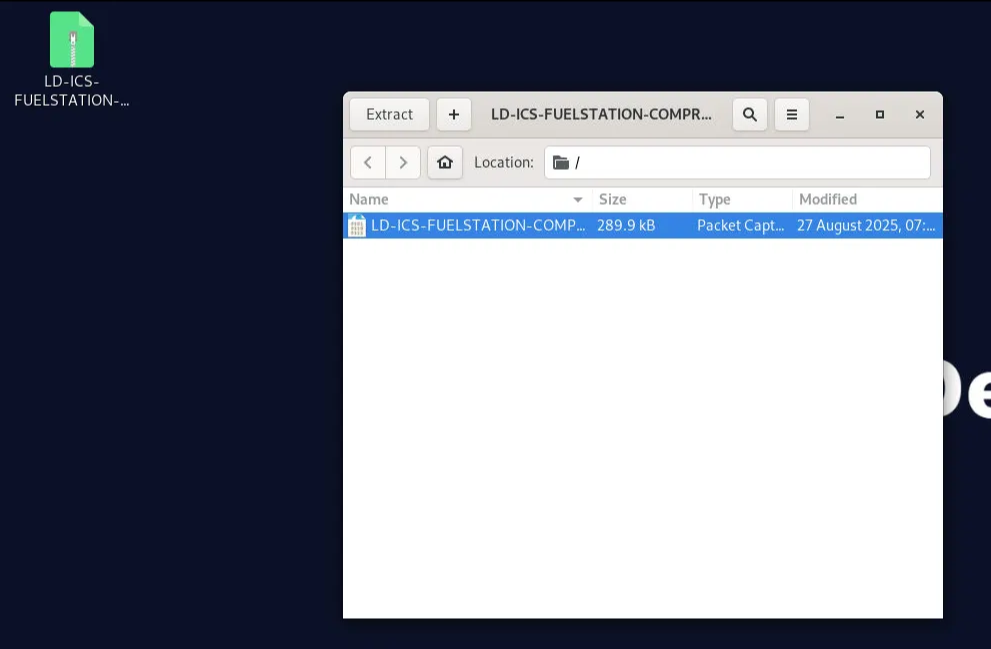
This archive contains network traffic captured during the suspected compromise. The full investigation is based on that capture, which means the findings in this report come from observable network evidence rather than guesswork or assumption.
Question 1
The attacker started off by scanning the subnet. When did port scanning activity start?
Answer Format: YYYY-MM-DD HH:MM:SS
Investigation: Identifying the Start of Port Scanning Activity
Why This Question Matters
In most intrusions, attackers begin with reconnaissance. Before they try to exploit a system, they first need to understand:
- What hosts are reachable
- Which services are exposed
- Which ports may be vulnerable
Port scanning is often the first clearly visible malicious action, so it gives us a strong starting point for building the incident timeline.
How the Activity Was Identified
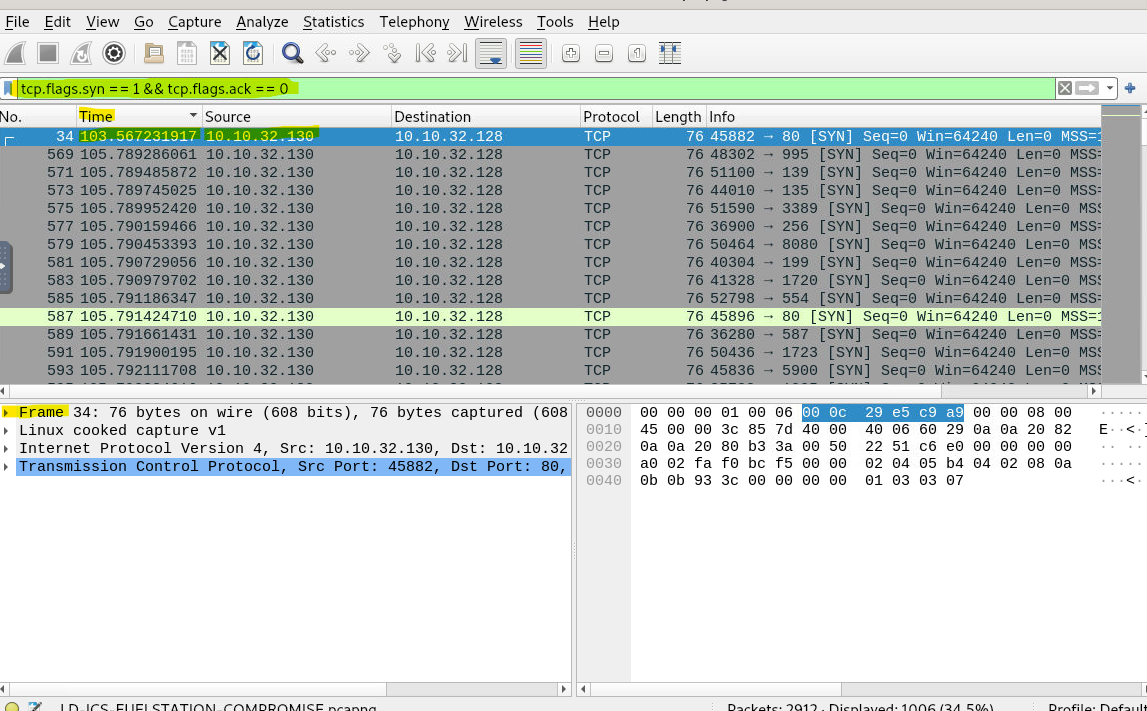
To identify port scanning behaviour, I looked for TCP connection attempts that were initiated but not completed. In Wireshark, one of the clearest ways to spot this is by filtering for TCP SYN packets that do not have matching ACK responses.
The following display filter was applied:
1
tcp.flags.syn ==1 && tcp.flags.ack == 0
What this filter shows (in simple terms):
- New connection attempts only
- No established or legitimate sessions
- Useful for spotting scanning or probing behaviour
Once the filter was applied, the capture showed a clear pattern of repeated SYN packets coming from one host and targeting multiple ports on another system.
What the Traffic Revealed
The filtered traffic showed:
- Source IP:
10.10.32.130(attacker) - Destination IP:
10.10.32.128(target system) - Rapid SYN packets sent to many different ports
That is a classic sign of automated port scanning, not normal user or application traffic.
Determining the Exact Start Time
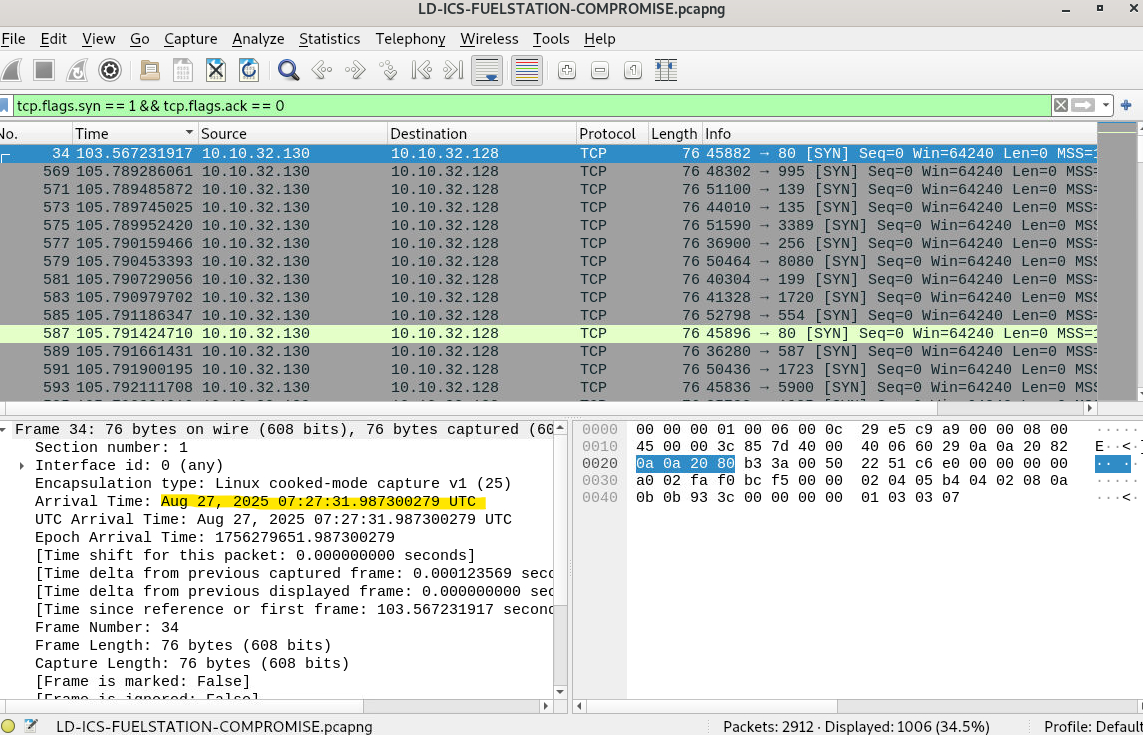
After isolating the scanning packets, I sorted the packet list by time. The earliest SYN packet sent by the attacker marked the start of the reconnaissance phase.
The timestamp on the first scanning packet was:
1
Aug 27, 2025 07:27:31 UTC
This timestamp represents the first confirmed malicious action visible in the packet capture.
Final Answer
Port scanning activity started at:
2025-08-27 07:27:31
What This Tells Us
This point marks the true start of the incident. Everything that followed, including service discovery, unauthorized access to the tank gauge system, data retrieval, and ransom messaging, can be traced back to this first scan.
In short:
This is the moment reconnaissance became an active attack.
Question 2
When did the port scanning activity stop?
Answer Format: (YYYY-MM-DD HH:MM:SS)
Analysis and Explanation
After identifying when the port scanning activity began, the next step was to work out when it ended. Knowing the exact end time helps define the full length of the reconnaissance phase and shows when the attacker shifted from broad discovery to more focused activity.
How This Was Identified in Wireshark
To stay consistent and avoid false conclusions, I used the same scan-detection logic as before. In Wireshark, the following display filter was applied:
1
ip.src == 10.10.32.130 && tcp.flags.syn == 1 && tcp.flags.ack == 0
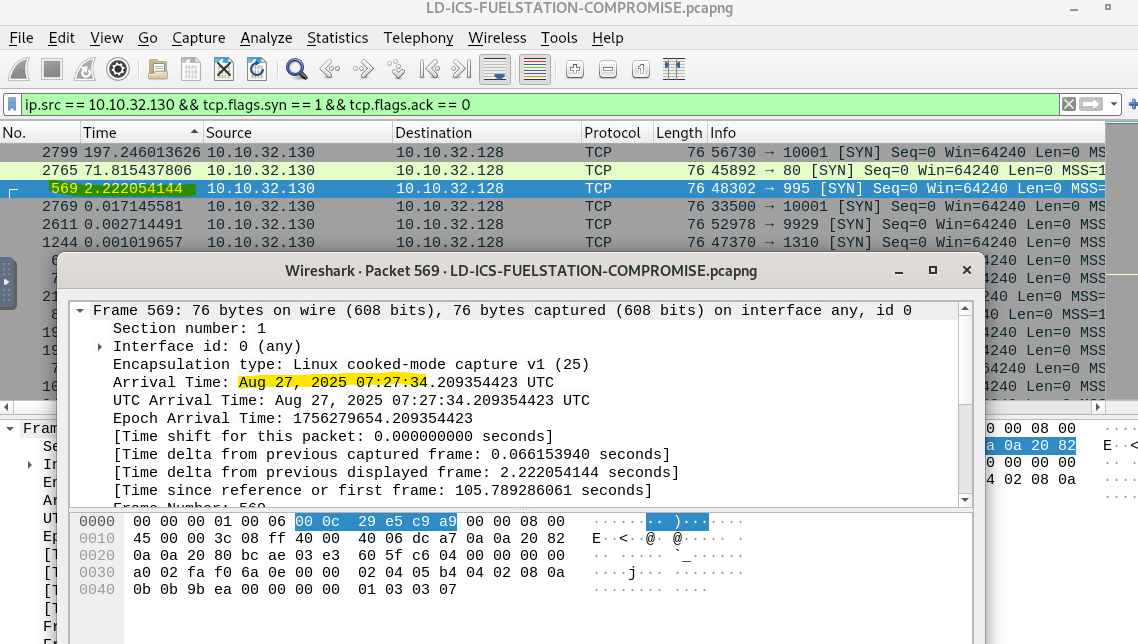
This filter isolates TCP SYN packets sent by the suspected source host that are not part of an established connection. A fast sequence of these packets aimed at different destination ports is a well-known sign of port scanning.
Reviewing the Final Scan Packet
With the filter applied, the packet list was reviewed in chronological order. The image above highlights the last TCP SYN packet matching the scan pattern. When that packet is selected, the packet details pane shows the arrival timestamp:
1
Aug 27, 2025 07:27:34 UTC
Immediately after that packet, the burst of SYN-only traffic stops. The packets that follow no longer match the scan pattern and instead show more targeted communication, which suggests the reconnaissance phase had ended.
Why This Timestamp Matters
Port scanning usually happens very quickly, especially when an automated tool is involved. In this case, the scan finished in only a few seconds. Pinpointing the end time confirms that:
- The attacker finished mapping exposed services
- Reconnaissance activity was short and deliberate
- The next phase of the attack likely began right after
Based on the last observed SYN-only packet, the port scanning activity stopped at:
Final Answer
Answer: 2025-08-27 07:27:34
Question 3
Please identify the IP Address of the internal asset used by the threat actor.
Analysis and Explanation
After establishing the timeframe of the port scan, the next step was to identify which internal system initiated it. Finding the source asset matters because it helps separate compromised systems from victim systems during incident response.
The investigation focused on the same packets linked to the port scan. These packets were isolated using a TCP SYN scan detection filter, which highlights connection attempts that are not part of an established session:
1
tcp.flags.syn == 1 && tcp.flags.ack == 0
When reviewing the filtered results, I focused on the Source and Destination fields for each packet. Across the full scanning sequence, the traffic showed a consistent pattern:
- One internal host repeatedly initiated SYN packets
- The same destination host was targeted across multiple ports
- No variation in the scanning source was observed
That consistency strongly suggests a single internal system was responsible for the reconnaissance activity. In an enterprise or ICS environment, this is abnormal behaviour and usually points to either a compromised endpoint or unauthorized internal access.
Because the scanning activity came from inside the network rather than an external address, this finding shows the attacker already had internal network access when reconnaissance began.
Final Answer
Answer: 10.10.32.130
Question 4
Which port other than the tank gauge system was open on the system?
Analysis and Explanation
After identifying the internal asset used by the threat actor, the next step was to determine which services were actually reachable on the target system. During a port scan, only ports that respond with a SYN, ACK packet are considered open. The rest usually return a reset (RST) or no response at all.
To identify open ports, the following Wireshark display filter was applied:
1
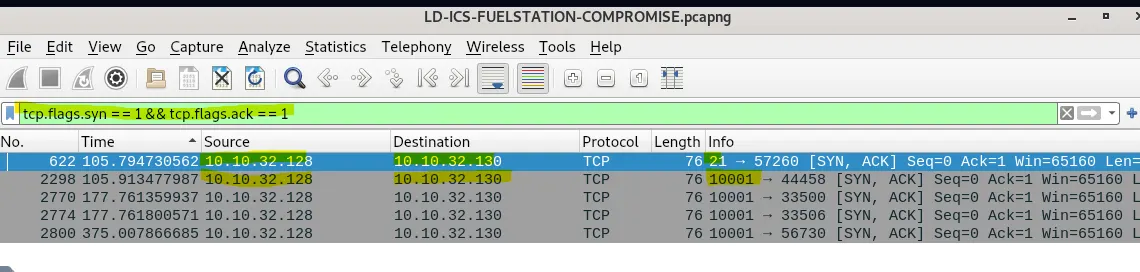
tcp.flags.syn == 1 && tcp.flags.ack == 1

This filter isolates successful connection acknowledgements, which indicate that a service is actively listening on the destination port.
Interpreting the Results
Once the filter was applied, only a small number of packets remained visible. These packets represent ports that responded positively to the scan. Among them:
- One response came from the tank gauge service port used later in the attack
- Another response clearly showed a different service replying with a SYN, ACK
By checking the destination port field of those SYN, ACK packets, it is clear that port 21 responded successfully.
Why This Is Important
Port 21 is traditionally associated with FTP (File Transfer Protocol). In industrial environments, FTP is often considered risky because it lacks encryption and is commonly misconfigured.
The presence of an open FTP service creates:
- Additional attack surface
- A potential path for credential theft
- A possible option for lateral movement or data exfiltration
Even though the tank gauge system was the main target, identifying other open services helps explain what additional opportunities the attacker may have had.
Final Answer
Answer: 21
Question 5
Which port was being used by the ICS system?
Analysis and Explanation
In the previous step (Question 4), the investigation identified which ports on the target system were open and accepting connections by analysing TCP responses to the port scan. This was done by filtering for SYN, ACK packets, which indicate that a service is actively listening on a port.
Using the following display filter:
1
tcp.flags.syn == 1 && tcp.flags.ack == 1
only two ports responded positively to the scan:
- Port 21, which was identified as an FTP service
- Another high-numbered port that consistently responded with SYN, ACK packets
Correlating Open Ports With Post-Scan Activity
After the scanning phase ended, the attacker did not continue interacting with port 21. Instead, all later communication, especially packets carrying application data, was directed toward the second open port.
By examining traffic to that port:
- Repeated TCP sessions were established
- Payload-carrying packets (PSH, ACK) were observed
- The returned data included tank inventory, delivery reports, leak detection status, and shift information
That kind of data is not associated with standard IT services like FTP or HTTP. It clearly lines up with industrial control system (ICS) functionality, specifically an automated tank gauge system.
Why This Confirms the ICS Port
The reasoning process is straightforward:
- Question 4 identified which ports were open
- Only one non-FTP port showed sustained, data-rich communication
- That communication contained operational fuel station data
- Therefore, that port must belong to the ICS application
This avoids guessing and ties the conclusion directly to observable traffic.
Final Answer
Answer: 10001
Question 6
Can you confirm the Vendor of the Automated tank gauge system being used on the field?
Step-by-Step Analysis (How This Was Identified)
At this stage of the investigation, the following had already been confirmed:
- The ICS system was communicating over TCP port 10001
- The attacker was actively interacting with the system, not just scanning it
The next task was to extract application-level data from those communications to identify the tank gauge vendor.
Step 1 — Filter Traffic to the ICS Port
In Wireshark, I narrowed the traffic down to only packets communicating with the ICS service by applying the filter:
1
tcp.port == 10001
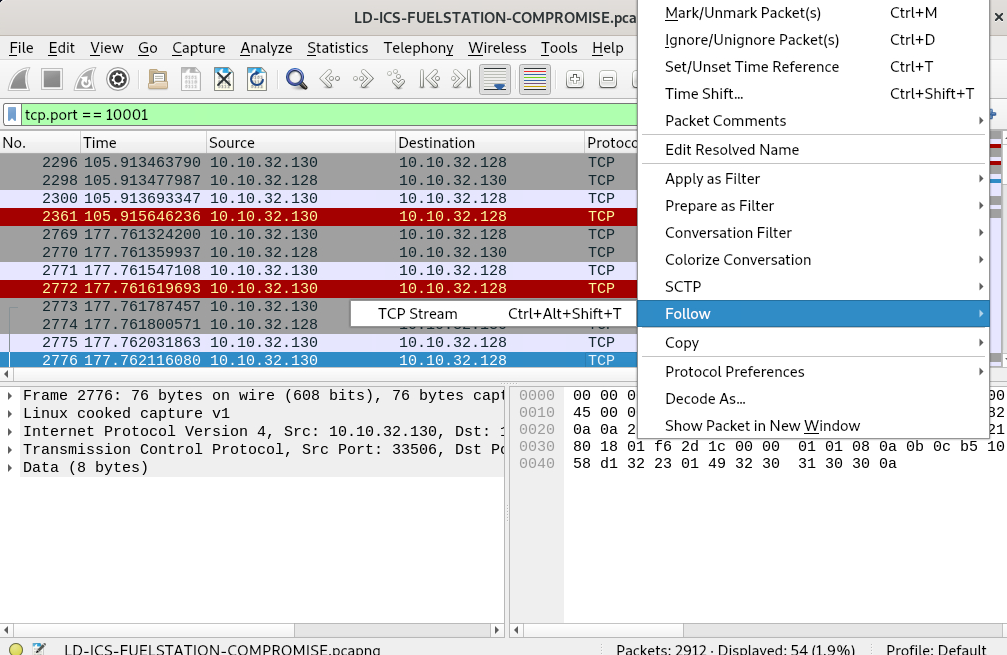
This removes unrelated noise and keeps the focus on traffic relevant to the tank gauge system.
Step 2 — Select a Packet Carrying Data
From the filtered results, a packet marked [PSH, ACK] was selected.
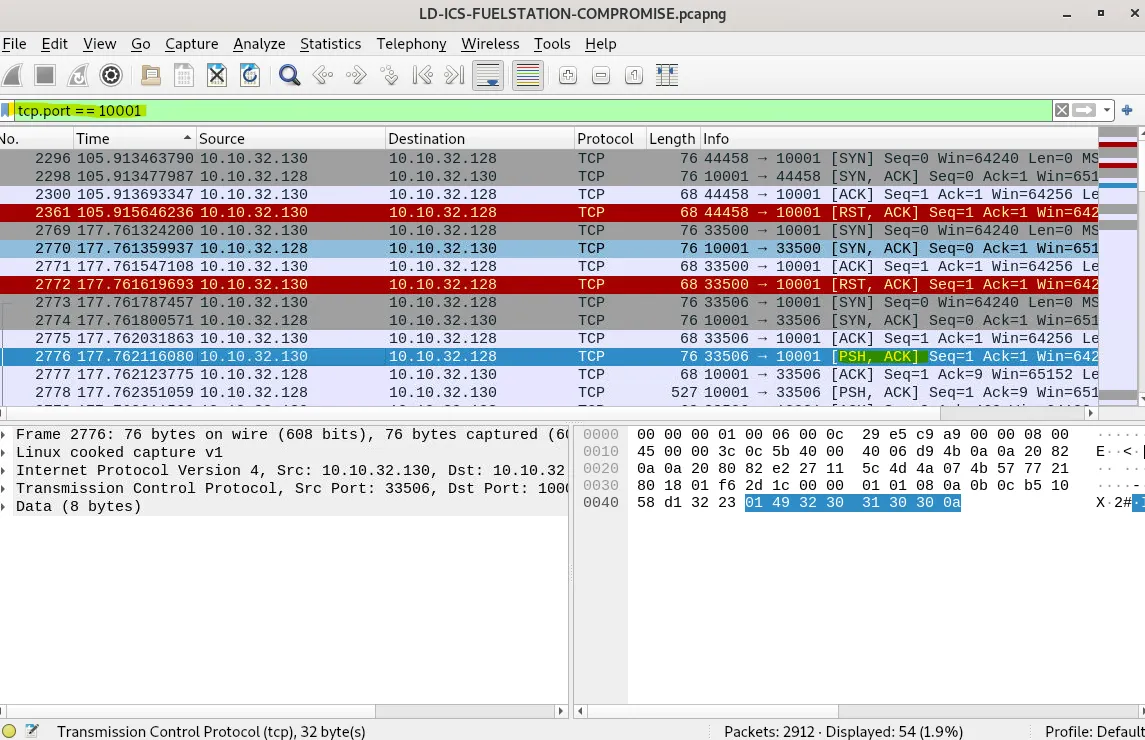
These packets show that payload data is being transmitted, not just the setup or teardown of a TCP connection.
This matters because vendor identifiers and system responses live inside the payload, not in the TCP header.
Step 3 — Follow the TCP Stream
With a data-carrying packet selected, the following action was performed:
Right-click → Follow → TCP Stream
This reconstructs the full conversation between the attacker and the ICS device into a readable format.
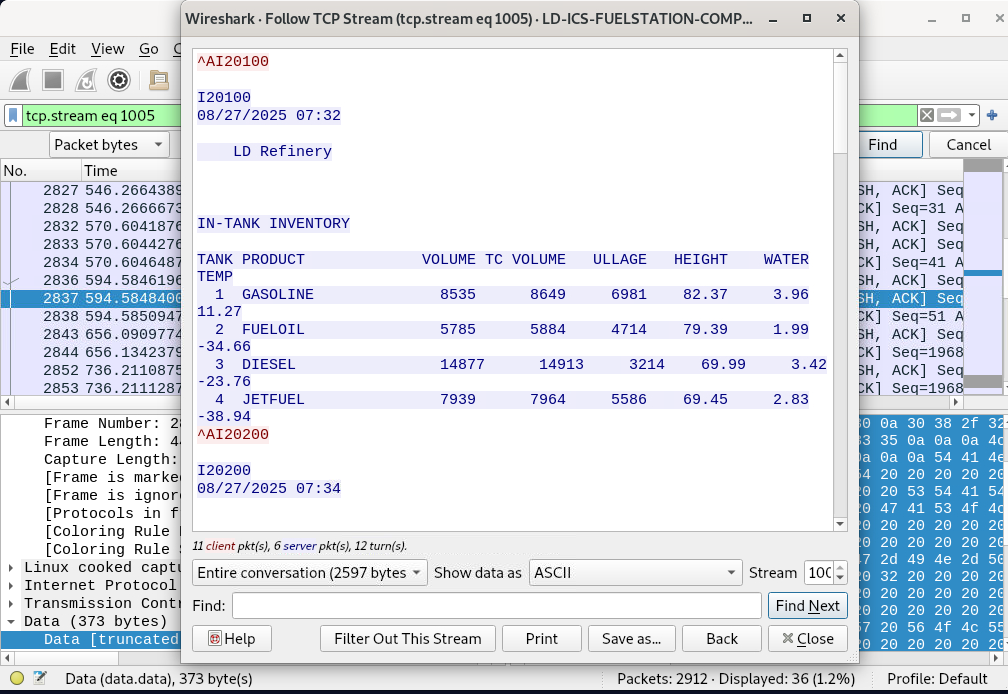
Step 4 — Inspect the Returned System Output
Inside the Follow TCP Stream window, the ICS system responded with structured, readable output including:
IN-TANK INVENTORY- Tank numbers and product names
- Volume, ullage, height, water, and temperature values
- A refinery identifier (
LD Refinery)
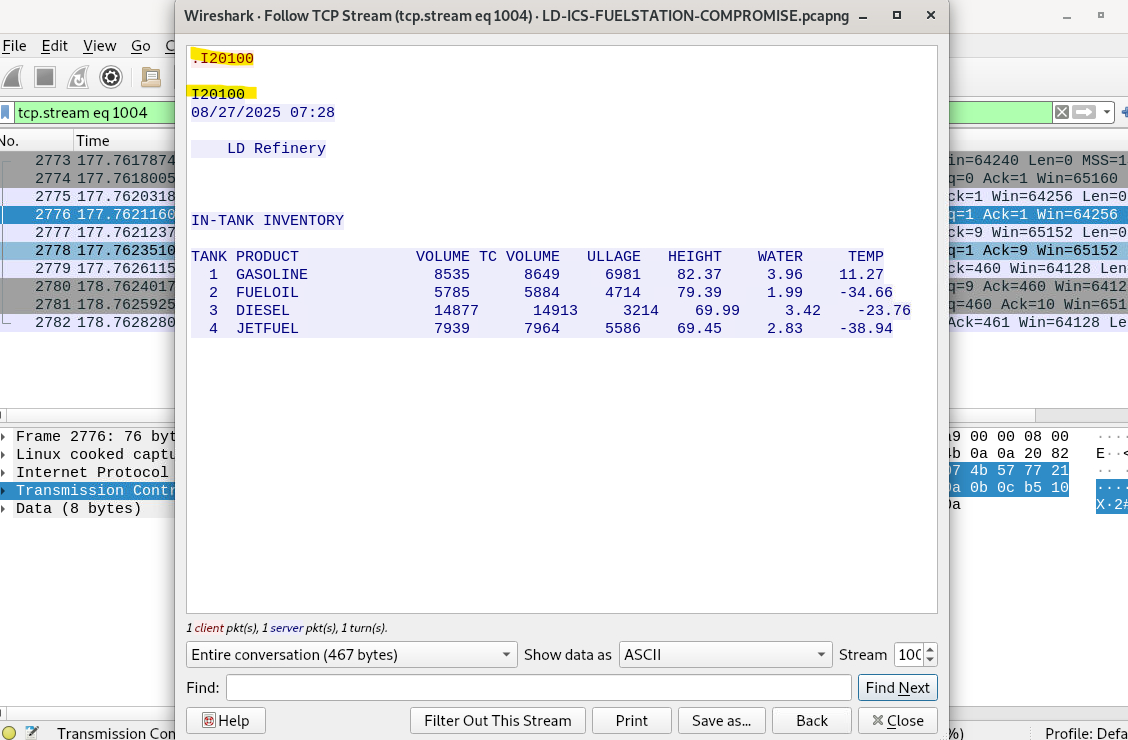
This output is not generic TCP data. It matches the known reporting style and command-response behaviour of Veeder-Root automated tank gauge systems, which are widely used in fuel stations.
Veeder-Root systems are well known for:
- Plain-text command interfaces
- Inventory and delivery reports formatted exactly like this
- Telnet-style interaction over proprietary TCP ports
The presence of the command code (I20100) followed by a formatted inventory report is a strong and recognizable indicator of a Veeder tank gauge system.
Why This Identification Is Reliable
In ICS incident response, vendor identification often comes from:
- Protocol behaviour
- Response formatting
- Command structure
- Operational terminology
This case includes all four, and they line up cleanly with Veeder systems. No other common tank gauge vendor uses this exact command and report structure.
Final Answer
Answer: Veeder
Question 7
What is the Name of the petroleum pump that was being attacked?
Step-by-Step Analysis (Derived from Question 6)
This finding is directly based on the analysis performed in Question 6, where the vendor of the Automated Tank Gauge (ATG) system was identified and active ICS communications were confirmed over TCP port 10001.
Building on that result, the investigation focused on extracting identifying information from the same ICS command-and-response traffic used to determine the vendor.
Step 1 — Reuse Confirmed ICS Traffic (From Question 6)
From Question 6, it was already established that:
- The system communicating on TCP port 10001 is an Automated Tank Gauge system
- The vendor is Veeder
- The traffic represents legitimate ATG command responses

Since this traffic had already been validated as ATG data, it could safely be reused to identify the petroleum pump name.
Step 2 — Follow the Same TCP Stream
Using the same packets identified in Question 6, a packet containing application data was selected and:
Right-click → Follow → TCP Stream
This reconstructs the full ATG response sent back to the requester.
Step 3 — Identify the Pump Name in the ATG Response
Within the Follow TCP Stream output, the ATG system clearly presented a header section before the inventory table.
The header included a site or pump identifier, shown as:
1
LD Refinery
This value is:
- Generated by the tank gauge system itself
- Displayed consistently across inventory responses
- Used to identify the petroleum pump or monitored site
Because this value originates from the ATG system response, it reliably identifies the petroleum pump under attack.
Why This Attribution Is Valid
- The data comes from verified ATG traffic identified in Question 6
- The pump name is system-generated, not attacker-controlled
- The naming format matches standard Automated Tank Gauge output
This confirms that the petroleum pump being targeted during the attack was the same system identified earlier in the investigation.
Final Answer
Answer: LD Refinery
Question 8
What is the function code used by the attacker for unauthorized access of data for delivery reports?
Step-by-Step Investigation (As Performed in Wireshark)
1. Focus on the ICS Service Traffic
From earlier questions, two important facts had already been confirmed:
- The ICS tank gauge system communicates on TCP port 10001
- The attacker’s internal system IP is 10.10.32.130
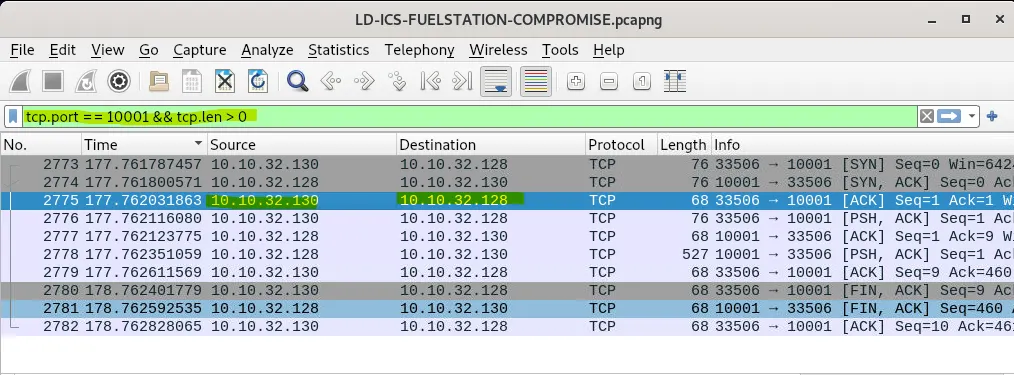
Using this information, the following display filter was applied in Wireshark:
1
tcp.port == 10001 && tcp.len > 0
Why this matters:
tcp.port == 10001isolates ICS protocol traffictcp.len \\\> 0removes handshake packets and keeps only packets carrying actual data
This keeps the analysis focused on meaningful application-level commands and responses.
2. Identify Packets Containing Readable ICS Commands
Within the filtered results, packets were observed where:
- Source and destination alternate between 10.10.32.130 (attacker) and 10.10.32.128 (tank gauge)
- Several packets are marked
\\\[PSH, ACK\\\], which indicates active data exchange
These packets were ideal candidates to inspect for command strings.
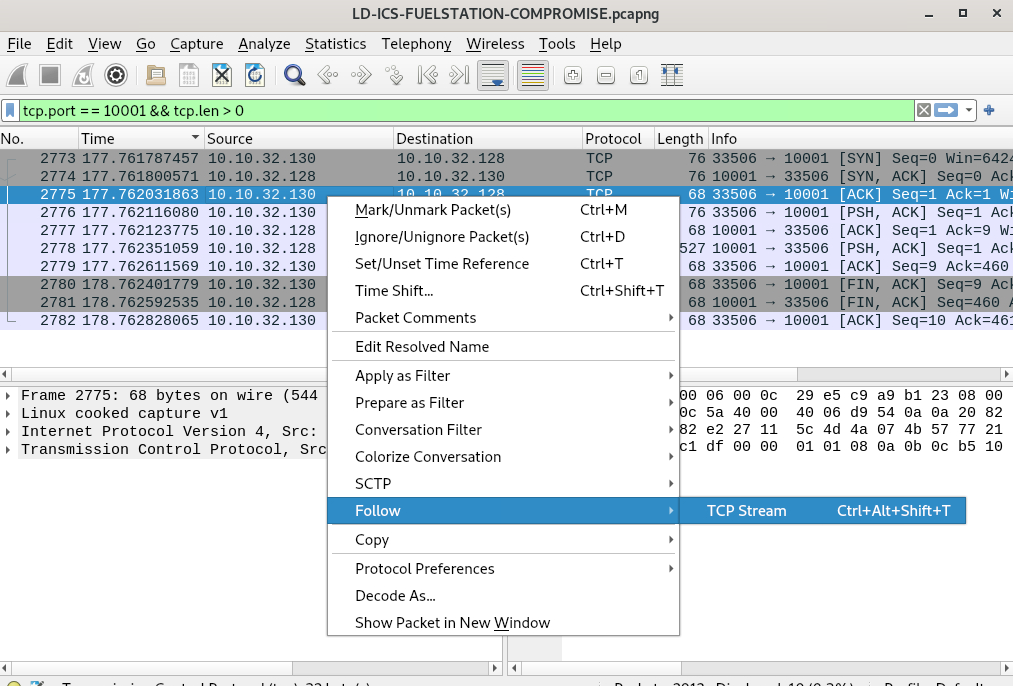
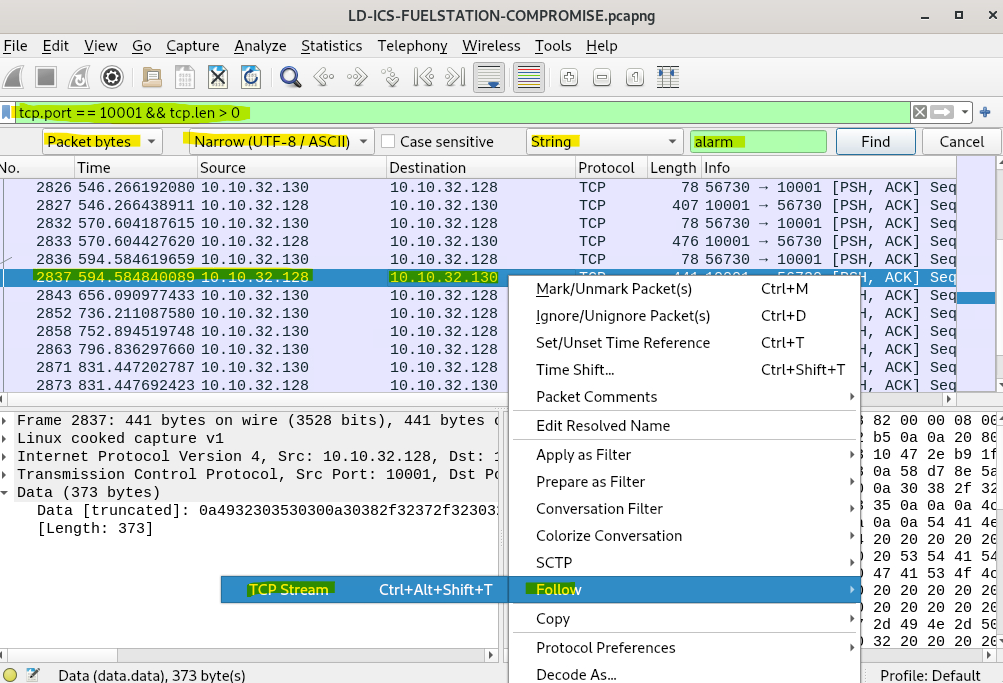
3. Follow the TCP Stream
Using the packets shown in the screenshots:
- Right-click on one of the
\\\[PSH, ACK\\\]packets - Select Follow → TCP Stream
This reconstructs the entire application conversation, rather than just showing individual packets.
Why this is critical:
ICS protocols often span multiple packets. Following the TCP stream lets us see the full command and response sequence exactly as the system processed it.
4. View the Stream as ASCII
In the Follow TCP Stream window:
- Set “Show data as: ASCII”
This reveals the ICS protocol messages in readable form.
5. Identify the Attacker-Issued Function Code
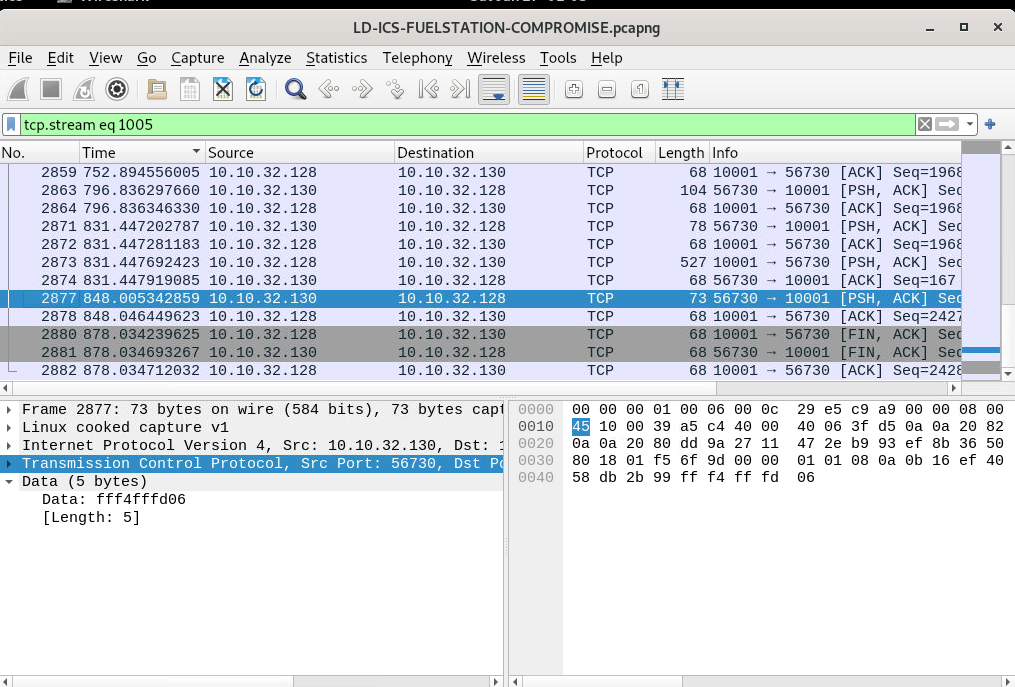
Key observations from the stream:
- Lines prefixed with
\\\^Aindicate Telnet control characters (Ctrl-A) - Immediately after
\\\^A, function codes beginning withIcan be seen
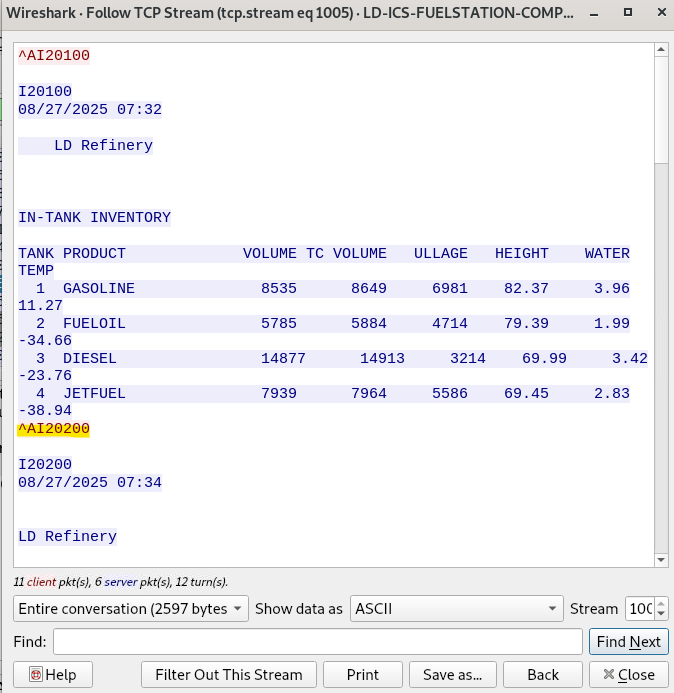
Why this confirms unauthorized access:
I20200is not a passive status message- It directly triggers a DELIVERY REPORT, which includes sensitive operational data
- The command originates from 10.10.32.130, which was previously identified as the attacker system
- The response is successfully returned by the tank gauge, confirming the command was accepted
This shows active command execution, not routine monitoring.
6. Confirm Intent Using Content Validation
Immediately after I20200, the stream outputs:
This directly links the function code to delivery report retrieval, confirming:
- The function code’s purpose
- The attacker’s intent to retrieve operational fuel delivery data
Final Answer
Answer: I20200
Question 9
At what time was a leak detected from one of the tanks?
Answer Format: (12:10 PM)
Step-by-Step: How the Leak Detection Time Was Identified
1. Narrow the Traffic to the Tank Gauge System
The investigation begins by isolating traffic related to the automated tank gauge system. This system communicates over a known ICS service port.
A display filter is applied to focus only on meaningful tank gauge data:
1
tcp.port == 10001 && tcp.len > 0
Why this matters:
- Port 10001 is used by the ICS tank gauge system
tcp.len \\\> 0removes empty TCP packets and keeps only packets carrying actual data (commands or responses)
This immediately cuts down noise and keeps the analysis focused on tank gauge communications.
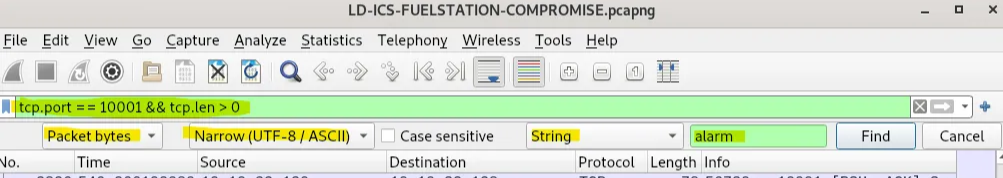
2. Search Packet Contents for Alarm-Related Data
Instead of manually scrolling through packets, a targeted content search is used.
In the packet list pane:
- Set the search type to Packet bytes
- Set the format to Narrow (UTF-8 / ASCII)
- Select String
-
Search for the keyword:
1
  alarm
Why this matters:
Leak detections are alarm conditions generated by the tank gauge system. Searching for the word alarm is a quick way to find packets related to abnormal or critical events, such as leaks.
This search highlights packets that contain alarm-related responses from the ICS system.
3. Identify a Packet Carrying Alarm Data
Once a packet containing alarm-related text is found, it indicates that the tank gauge system has returned a status message related to a leak or warning condition.
These packets are usually larger and part of an interactive session between the attacker and the ICS system.
4. Reconstruct the Full Conversation Using Follow TCP Stream
To see the full context of the alarm message:
- Right-click the identified packet
- Select Follow → TCP Stream
Why this matters:
Tank gauge responses are often split across multiple TCP packets. Following the TCP stream rebuilds the full exchange into a single readable output, preserving the order and meaning of the report.
5. View the Stream as Readable Text
Inside the Follow TCP Stream window:
- Set Show data as:
ASCII
This presents the tank gauge output the way it would appear in a terminal or management console.
6. Locate the Leak Detection Message Within the Stream
Within the reconstructed stream, the tank status report clearly lists each tank and its leak test status.
The relevant section shows:
- Tank identifiers
- Test status
- Leak detection results
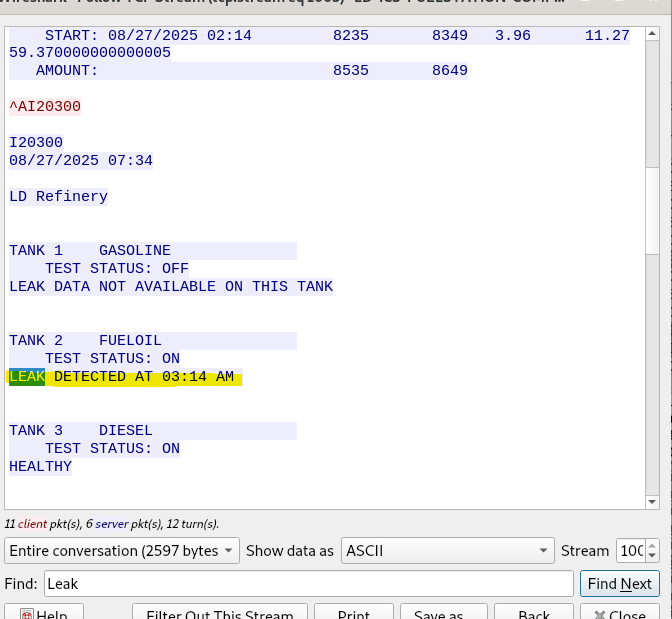
One tank explicitly reports a leak detection event, including the exact time the leak was detected.
7. Extract the Leak Detection Time
The leak time is taken directly from the tank gauge system’s response line that states when the leak was detected. This timestamp is the system-recorded event time, making it the most reliable source for answering the question.
Final Answer
Answer: 03:14 AM
Question 10
What was the status of the 1st product in the inventory?
After identifying and following the correct TCP stream in the previous step, the same stream was reviewed further by scrolling down through the inventory report. The report lists each tank, its product type, and the current operational status.
The first entry in the inventory corresponds to Tank 1 (Gasoline). Its status is clearly displayed in the inventory table.
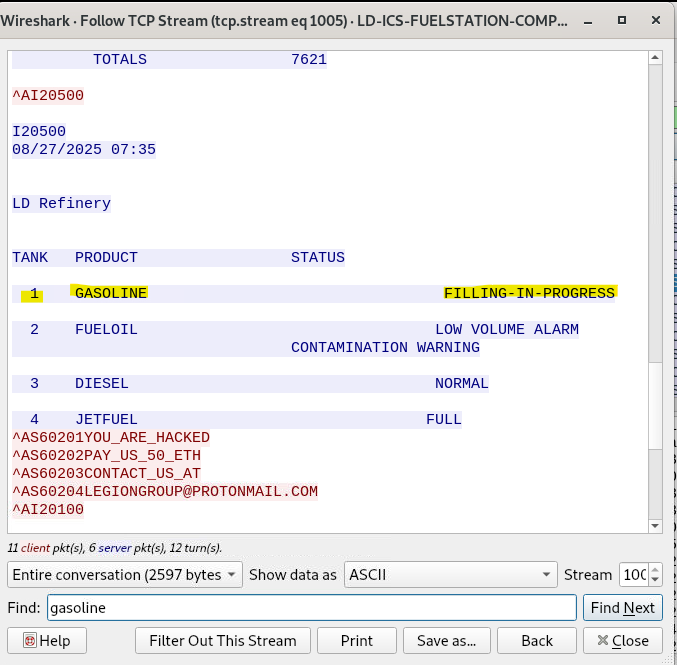
Answer: FILLING-IN-PROGRESS
Question 11
The attacker got access to the Delivery reports for the station. When was the time for the last delivery?
To determine this, the analysis stayed within the same ICS TCP communication already identified earlier.
First, traffic to the ICS system was filtered using the known port (tcp.port == 10001) and packets containing application data (tcp.len \\\> 0). From there, the relevant TCP conversation was followed using Follow → TCP Stream to reconstruct the full ICS message exchange in readable ASCII format.
Within the reconstructed stream, a section labelled DELIVERY REPORT appears. This report includes both a START and an END timestamp for the fuel delivery. The END timestamp represents when the most recent delivery was completed.
The report clearly shows the delivery ending at the following date and time.
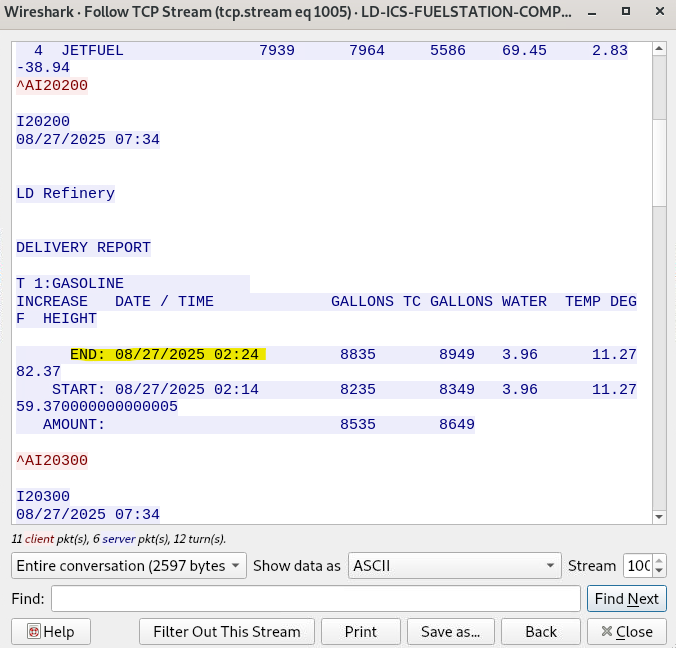
Answer: 2025-08-27 02:24
Question 12
When did the attacker gain access to the site’s shift reports?
To find this, the investigation continued using the same ICS communication stream that had already been identified earlier.
First, traffic was filtered to only include ICS-related packets using the known port (tcp.port == 10001) and packets carrying data (tcp.len \\\> 0). From this filtered traffic, the relevant session was reconstructed by following the TCP stream, which allowed the ICS messages to be viewed in readable ASCII format.
Within this stream, a section labeled SHIFT REPORT is clearly visible. Directly above the shift report details, the system displays a timestamp associated with the report request, indicating when the shift data was accessed.
That timestamp shows the exact moment the attacker retrieved the shift report.
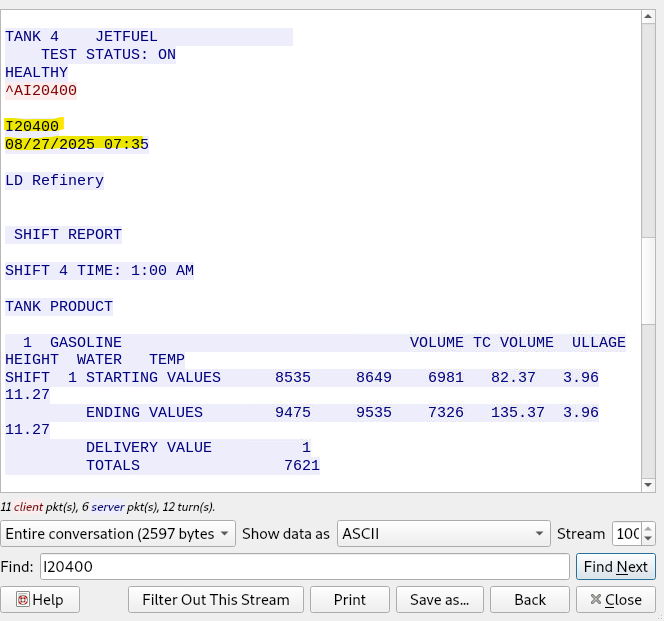
Answer: 2025-08-27 07:35
Question 13
What was the temperature of the 2nd Gasoline product at the time of the incident?
Step-by-Step Explanation:
- The investigation continued within the same ICS communication session by filtering traffic to the ICS port (
tcp.port == 10001) and ensuring only packets with payload were shown (tcp.len \\\> 0). - The relevant TCP conversation was reconstructed using Follow → TCP Stream, which allowed the tank inventory data to be viewed in readable ASCII format.
- Inside the IN-TANK INVENTORY section, each tank entry is listed with its product name and associated measurements.
- The second product entry highlighted in the inventory list shows its temperature value in the TEMP column.
- This temperature reflects the state of the system at the time the attacker accessed the data.
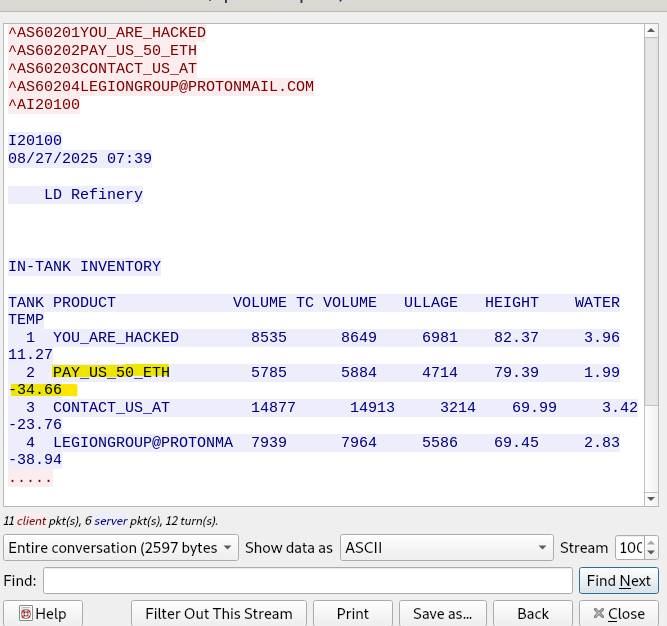
Answer: -34.66
Question 14
What is the name of the product in the Fourth tank?
Step-by-Step Explanation:
- Continue working in the same ICS data session by keeping the filter applied to the ICS communication (
tcp.port == 10001with payload traffic). - Open the relevant conversation using Follow → TCP Stream so the data is displayed in readable ASCII format.
- In the IN-TANK INVENTORY section, the tanks are listed numerically from Tank 1 through Tank 4.
- Locate Tank 4 in the list and read the PRODUCT column associated with it.
- The product name is clearly shown next to the tank number.
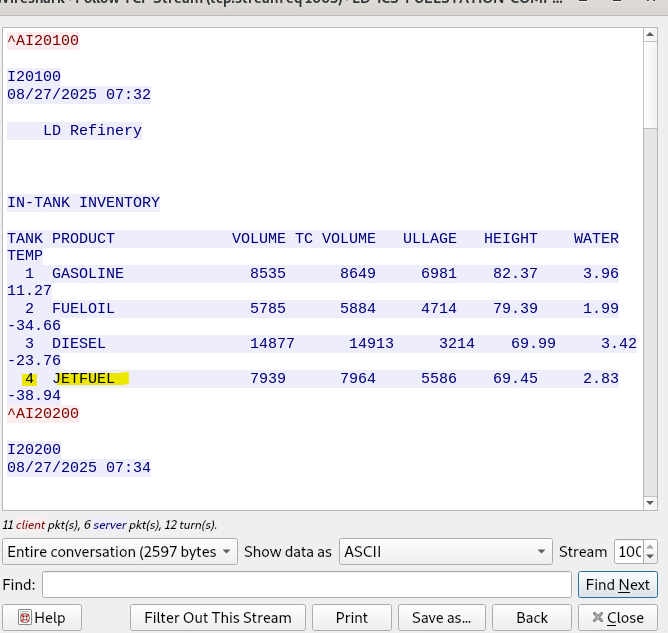
Answer: JetFuel
Question 15
What was the hostname of the machine running the tank gauge software?
Step-by-Step Explanation:
-
Filter for DHCP traffic
Since hostnames are commonly exchanged during IP assignment, the first step was to apply a
dhcpdisplay filter in Wireshark. This isolates Dynamic Host Configuration Protocol traffic, which often contains identifying information about the client device.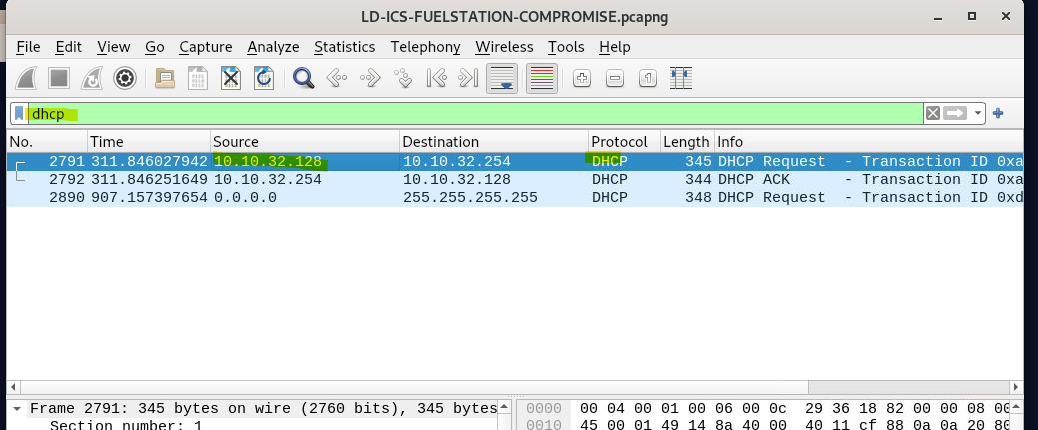
-
Identify the tank gauge IP address
From earlier analysis, the tank gauge system was already associated with the internal IP address
10.10.32.128. The DHCP packets involving this IP were therefore the main focus.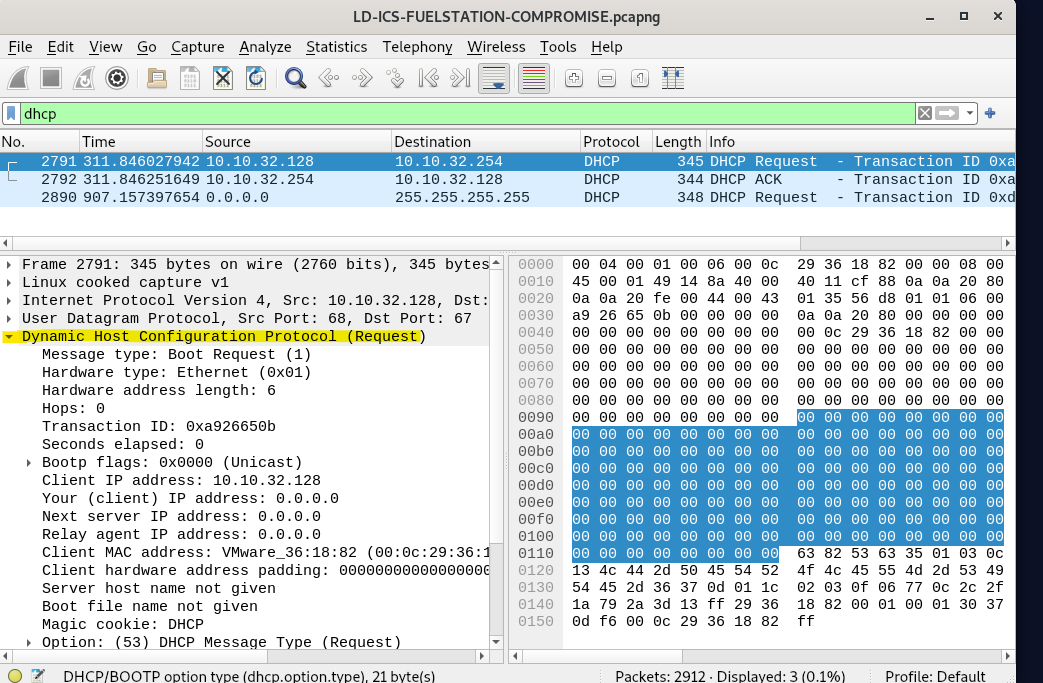
-
Inspect the DHCP Request packet
Opening a DHCP Request packet from
10.10.32.128reveals detailed DHCP options in the packet details pane. -
Locate the Host Name option (Option 12)
Within the DHCP options, Option (12) – Host Name is present. This field explicitly provides the hostname the device reports to the network when requesting an IP address.
-
Read the hostname value
The value shown in Option 12 directly identifies the system running the tank gauge software.
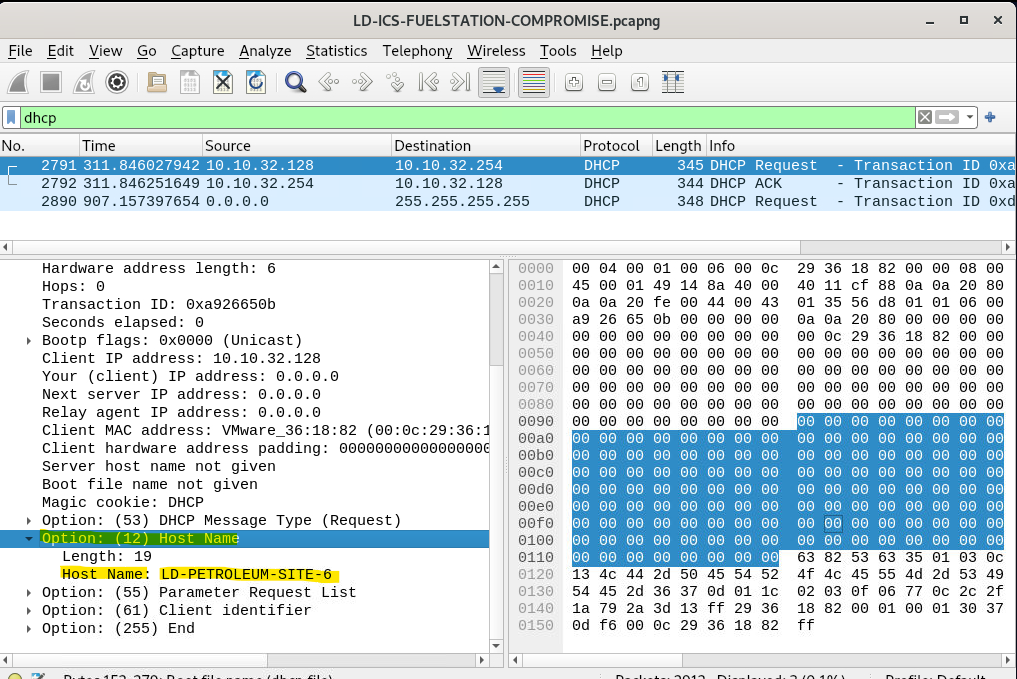
Answer: LD-PETROLEUM-SITE-6
Question 16
The Attacker manipulated the tank gauge values and changed the product names to deliver a message to the organization and staff, demanding a ransom payment. What was the ransom amount demanded by the attacker?
Step-by-Step Explanation:
-
This was already uncovered earlier in Question 9
During the earlier step where the TCP stream on port
10001was followed, the attacker’s manipulation of the tank gauge data was already visible. -
Scroll further down in the same TCP stream
In the same stream that showed tank statuses and inventory, additional lines appear where product names were altered.
-
Identify the ransom message embedded as product names
The attacker replaced legitimate product names with messages such as:
YOU_ARE_HACKEDPAY_US_50_ETHCONTACT_US_AT- an email address for contact
These clearly indicate a ransom demand.
-
Extract the demanded amount directly from the message
The string
PAY_US_50_ETHexplicitly states the ransom value.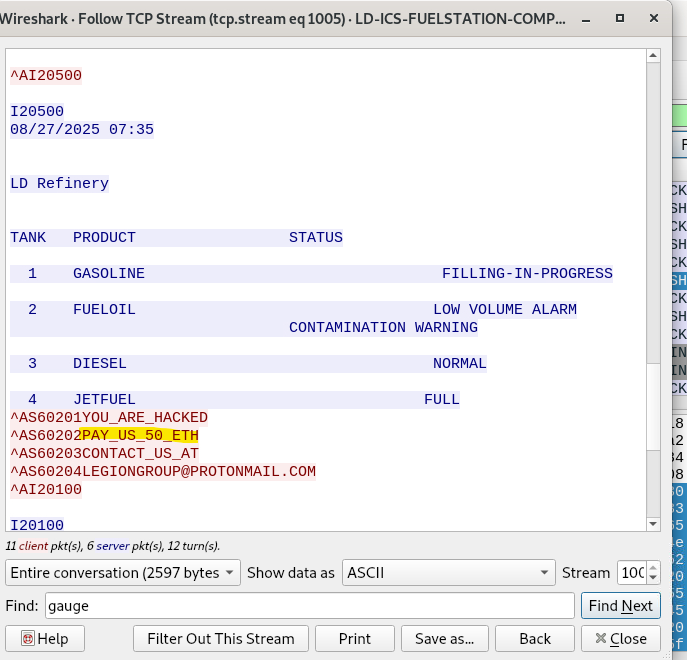
Answer: 50 Ethereum
Question 17
What was the email address associated with the attacker?
Step-by-Step Explanation:
-
This finding comes from the same analysis performed in Question 9
While reviewing the TCP stream on the ICS communication port, the attacker’s manipulation of tank data was already visible.
-
Continue scrolling within the same TCP stream
Below the altered tank product names and ransom demand, additional text appears embedded directly in the data returned by the tank gauge system.
-
Identify the contact instruction left by the attacker
Among the modified entries is a clear instruction telling the organization how to make contact, followed by an email address.
-
Extract the email address exactly as shown
The address is presented in plain text as part of the attacker’s message.
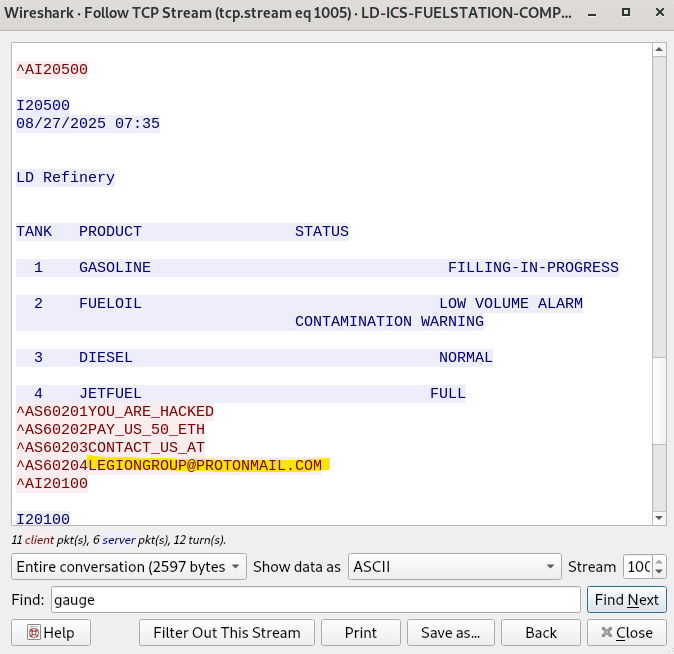
Answer: legiongroup@protonmail.com
Summary
Overall, this challenge was a really good example of how an attack can move from simple reconnaissance into something much more serious. What started as a short burst of port scanning quickly led to direct interaction with the tank gauge system, access to sensitive operational data, and eventually manipulation of the system itself.
Working through the packet capture in Wireshark helped me piece the whole incident together step by step. I was able to identify when the scan started and stopped, which internal host was being used by the attacker, which services were exposed, and how the attacker moved from discovery into active access of the ICS environment.
What stood out most to me was how much could be uncovered just by carefully following the traffic and validating each finding against the evidence. Once I started digging into the TCP streams, the bigger picture became clear. The attacker was not just scanning the network. They were interacting directly with the tank gauge system, pulling inventory, delivery, shift, and alarm-related data, and then changing product names to push a ransom message to the organisation.
For me, this challenge reinforced how important it is to stay methodical during an investigation. Even in an ICS scenario that looks technical and complex at first, the key is to slow down, follow the evidence, and build the timeline properly. It also showed how dangerous exposed industrial services can be when an attacker is able to reach them, especially when those systems are tied to real operational processes rather than just standard IT assets.